Housing Reconstruction Monitoring Dashboard
Published on November 3, 2021 / Leer en español
Updated on June 2023
AUTHORS
Research Director
Research Fellow
RELATED CONTENT
SHARE
On September 2017, Puerto Rico was struck by two major hurricanes that caused widespread damage. Hurricane Irma, a category 5 storm, made landfall on September 6th while Hurricane María, a category 4 storm, followed on September 20th. The combined impact from these events left Puerto Rico’s infrastructure in dire conditions, but it is their impact on housing that has had a lasting effect on households and communities in the archipelago. More than four years since these catastrophic events took place, communities, grassroots organizations, and other stakeholders need a clear and broad picture of how ongoing reconstruction efforts have been able to address housing needs in post-disaster Puerto Rico.
The Housing Reconstruction Monitoring Dashboard (HRMD) is an interactive and dynamic tool that provides detailed data, at the municipal level, on housing damages and reconstruction investments related to Hurricanes Irma and María. It is an outgrowth of a larger academic project that focuses on analyzing the provision of emergency housing relief through FEMA’s Individual Assistance Program. The primary objective of the Dashboard is to keep an eye on housing reconstruction efforts throughout the post-disaster period and raise awareness of the needed investments to effectively repair the widespread damage caused by the 2017 storms.
All the data used to build the tables and visualizations that make up the digital tool, and those contained in this report, are public. We have spent considerable time examining each dataset to produce initial analyses that provide a clearer picture of the ongoing housing reconstruction process. As new programs emerge and investments increase, we will update the digital tool and expand our research portfolio.
Our User’s Guide provides a detailed explanation of the data sources and methods we used to arrive at these numbers.
Click the link on the Related Content section of the sidebar to read the User’s Guide.
The dashboard is optimized for desktop use. To view the dashboard in full-screen mode, press the icon ![]() in the lower right corner.
in the lower right corner.
You can also download the dataset by clicking on the icon ![]() in the lower right corner.
in the lower right corner.
If you have any problems, you can refresh the page to start over, or can send any questions on how to use the dashboard to info@grupocne.org.
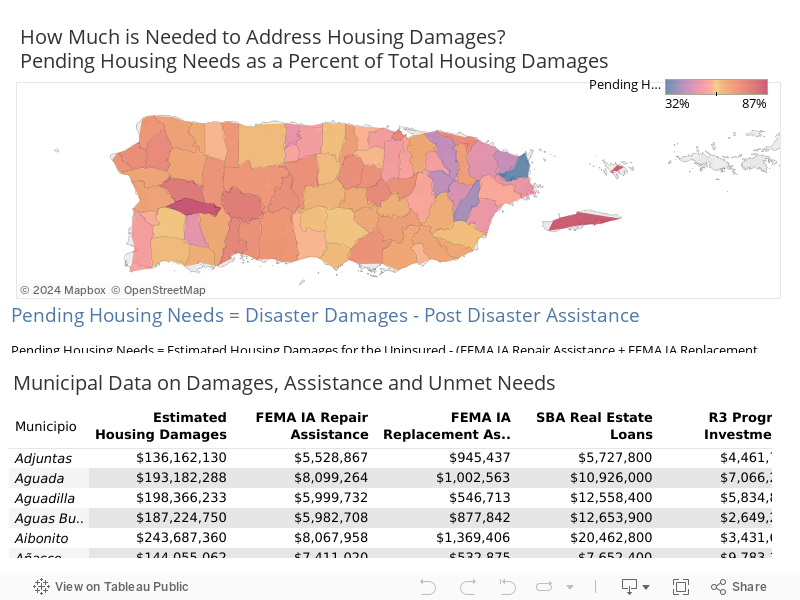
Visuals in the HMRD include:
- Top: Map showing total housing pending needs as well as housing pending needs as a percentage of total housing damages per municipality.
- Bottom: Table listing, for each municipality in Puerto Rico, total housing damages, total repair, and reconstruction investment by federal and local government program, total housing pending needs, and housing pending needs as a percentage of total housing damages.
Acknowledgments:
This project is part of CNE’s Blueprint Initiative and was developed in partnership with Habitat for Humanity of Puerto Rico.