Let's Get Going: Next Steps in Puerto Rico’s Energy Transformation
Published on May 21, 2024 / Leer en español

Introduction
In late March the U.S. Department of Energy (“DOE”) released the final report of its study of Puerto Rico’s electric grid and its options for implementing a transition to 100% renewable generation by 2050. The final report entitled Puerto Rico Grid Resilience and Transitions to 100% Renewable Energy Study (“PR100 Study) is (1) the product of a two-year effort carried out by several of the National Laboratories in conjunction with a broad group of Puerto Rican stakeholders; (2) a comprehensive diagnostic of Puerto Rico’s electric system; and (3) a wide-ranging analysis of the challenges to attain the goal of using only renewable energy sources for the generation of electricity in Puerto Rico.
We reviewed a summary of the main findings of the PR100 Study in a prior CNE Review. This time around we want to focus on a handful of issues that we believe merit further public discussion and analysis in Puerto Rico. Specifically, we will highlight (1) the complexity of achieving the 100% goal; (2) the need to make difficult tradeoffs and hard policy decisions to execute the transition; (3) the cost of the investments required to achieve this undertaking; (4) the economic impact of this process; and (5) some risks and uncertainties that remain to be addressed.
Before moving on with our analysis, we note that the final report is over 800 pages long. Unfortunately, a full analysis of such a comprehensive document is well beyond the scope of this policy brief. We do encourage all interested parties to take a look at the document, which has been translated into Spanish, in case they want to obtain a more detailed analysis of any issue related to the transition to 100% renewable generation.
Section 1: It’s Complicated 
Sometimes in the heat of public debate, it is easy to overlook the complexity of the process Puerto Rico is undertaking as it moves towards 100% renewable generation. This is a multi-year, multi-billion dollar process, with many moving parts. Meticulous resource, technical, and economic assessments need to be made, even as the technology itself is evolving. The Puerto Rico Electric Power Authority (“PREPA”), the legacy utility that still owns both the grid and a substantial fleet of fossil fuel generation, is currently undergoing a bankruptcy-like process to restructure its financial obligations. Several old-generation plants need to be decommissioned as renewable generation and large-scale battery storage systems have to be installed and interconnected to the grid. In addition, two new players, LUMA and Genera, are currently managing and operating the electric system, while the regulatory framework is relatively new and the main regulator, the Puerto Rico Energy Bureau (“PREB”), has only been in existence for ten years.
Priority Number One: Stabilize the Grid
Furthermore, Puerto Rico is starting the transition to 100% renewable generation with an electric system that is fragile and functioning well below recommended industry standards. The first priority, therefore, should be to stabilize the system and bring it up to 21st-century standards. On the generation side, the DOE found that “the current Puerto Rico grid is not reliable and needs immediate additional capacity to meet an acceptable level of performance.” (PR 100 Final Report, p. 240) With respect to the transmission system, the DOE found that “the lower-voltage (38-kV) transmission network components are insufficient to handle the projected system transitions” and 38-kV network upgrades are necessary to support the projected buildout of renewable generation. (PR 100 Final Report, p. 241) Finally, with respect to the distribution system, the DOE highlights that some “feeders as they exist in Puerto Rico today operate outside” standard voltages and several mitigating actions would have to be implemented to avoid “backfeeding” and voltage violations as significant photovoltaic (“PV”) generation is connected to the system. (PR100 Final Report, p. 347). This means that both LUMA, the grid operator, and Genera, which manages PREPA’s legacy generation fleet, need to undertake substantial remedial actions even as the system is transitioning to renewable sources of energy. It is our understanding that both LUMA and Genera are undertaking remedial measures to stabilize the electric system in the short term.
Too Many Cooks in the Kitchen
A multiplicity of government agencies and entities, at both the federal and state levels, with sometimes overlapping and partially interlocking jurisdictions add a second layer of complexity to this process. Among those agencies and entities, we find the following:
- The U.S. Department of Energy (“DOE”) – Carried out the PR100 Study and was also allocated $1 billion by Congress to finance distributed energy projects at the community level in Puerto Rico.
- The Federal Emergency Management Agency (“FEMA”) – Administers and oversees the use of $13.7 billion allocated to rebuild the electric grid.
- The U.S. Department of Housing and Urban Development (“HUD”) – Is in charge of administering approximately $1.9 billion in CDBG funds to upgrade Puerto Rico’s energy system.
- Central Office for Recovery, Reconstruction, and Resiliency (“COR3”) – The main liaison between the government of Puerto Rico and FEMA. The COR3 is technically the grantee for most federal reconstruction funding.
- Puerto Rico Department of Housing (“DOH”) – Administers and oversees the use of CDBG funds in Puerto Rico.
- Puerto Rico Energy Bureau (“PREB”) – The independent regulator of Puerto Rico’s electric system. It has a statutory mandate to regulate the generation and sale of electricity in the island; to set rates; and to plan for the efficient long-term operation of the electric system, among other important matters.
- Puerto Rico Electric Power Authority (“PREPA”) – Puerto Rico’s legacy utility, currently in bankruptcy and the nominal owner of the assets of Puerto Rico’s electric system.
- LUMA – Private manager and operator of Puerto Rico’s electric grid. In charge of authorizing interconnections to the grid and dispatching electricity.
- Genera – Private manager and operator of PREPA’s legacy generation assets. In charge of decommissioning existing fossil-fuel generation and coordinating the ramp-up of new renewable generation resources.
- AES and EcoEléctrica – Independent power producers with an aggregate generation capacity of approximately 900 MW using coal and natural gas, respectively. The AES plant is statutorily required to be shut down in 2028.
- Public Private Partnership Administration (“P3A”) – Executes limited oversight functions pursuant to the operation and management agreements executed with each LUMA and Genera, respectively.
- Fiscal Oversight and Management Board (“FOMB”) – Represents PREPA in its bankruptcy process. Has oversight powers over PREPA pursuant to PROMESA. Certifies PREPA’s annual Fiscal Plan and its operating budget. Exercises authority under PROMESA to review certain contracts covered by that law. In the case of PREPA, it has been in charge of reviewing the terms and conditions of the power purchase agreements between developers of utility-scale renewable generation and PREPA.
- The United States District Court for the District of Puerto Rico (“Federal Court”) – Has jurisdiction over PREPA’s bankruptcy under Title III of PROMESA. It will eventually determine how much PREPA’s creditors can recover from the bankrupt utility and certify a Plan of Adjustment (“POA”). The POA will affect electricity rates in so far as it provides for the imposition of a special charge to repay bondholders and PREPA is otherwise unable to generate offsetting cost savings.
In addition, there are dozens of consultants, suppliers, rooftop solar systems vendors, developers of utility-scale renewable generation sites, trade organizations, NGOs, community-based organizations, and other stakeholders with a direct interest in the transition to 100% renewable generation.
The problem we see is that there appears to be little or no coordination among and between all these actors. In our view, the PREB, as Puerto Rico’s energy regulator, should be the principal player coordinating the upgrade of the grid, the decommissioning of PREPA’s legacy assets, the ramp-up of renewable generation both on rooftops and at the utility scale, and in general making the key decisions, in consultation with the relevant stakeholders, regarding the long-term transition to 100% renewable generation by 2050.
There is More than One Pathway to 100% Renewable Generation
A third layer of complexity arises from the multiple pathways and combinations of generation technology that are least potentially available to reach the 100% goal. To briefly recapitulate, the DOE analyzed three scenarios, all based on the utilization of “mature” renewable technologies (with the exception of biodiesel to provide firm dispatchable generation towards the end of the transition period) and which vary according to (1) the amount of distributed energy resources; (2) the amount of land available for utility-scale generation (Less Land or More Land); and (3) two load forecasts (a Mid Case and a Stress Case). In addition, the DOE also took into account the level of technological development (Conservative, Moderate, or Advanced) throughout the transition period, a variable that is exogenous to Puerto Rico.
The three scenarios are:
(1) the Economic Adoption of distributed energy resources (“DERs”), which assumes the adoption of DERs is based on financial savings to home and business owners and their deployment is extended to critical infrastructure such as fire stations and hospitals;
(2) the Equitable Adoption of DERs, which assumes the deployment of DERs beyond that of Scenario 1 to include remote areas and very low-income households (defined as households earning 0%–30% of area median income); and
(3) the Maximum Adoption of DERs, which assumes deployment of DERs on all suitable rooftops.
As stated above, each scenario has four variations: Less Land or More Land (regarding land use) and Mid Case or Stress Case (regarding load), for a total of twelve scenarios. Scenarios are labeled by number, land variation, and load variation. Thus, Scenario 1LS means: Scenario 1, Economic Adoption, Less Land, Stress load.
We note that the DOE did not “examine any futures in which there is no central grid,” even under Scenario 3, which assumes the maximum adoption of DERs. (PR100 Final Report, p. 184) This means that in the world analyzed by the PR100 Study, there will always be fixed and variable costs that will have to be paid or financed in connection with the operation, maintenance, and future upgrading of a central grid.
In addition, in Scenarios 2 and 3, the DOE:
…forced in the adoption of significantly higher amounts of rooftop PV to examine the impacts of these levels of adoption. In this analysis, we did not assume how those systems would be paid for or whether any public or federal funds would be allocated to pay for them. By definition, Scenarios 2 and 3 exceed what is likely to be adopted based on bill savings and resilience savings. (PR100 Final Report, p. 185)
This means difficult tradeoffs will have to be made among and between cost, resilience, land use, and economic impact.
Section 2: There Are Tradeoffs
As could be expected in a project as complicated as this one, there are multiple tradeoffs involved. Sometimes those tradeoffs are explicit, while others are implicit or ambiguous. For example, the DOE states that “accelerating the deployment of rooftop PV and storage will therefore accelerate increased resilience. This greater building-level resilience might reduce both the urgency to restore the grid after an outage and the resilience needs for the grid system.” (PR100 Final Report, p. 186)
Now, this statement could be interpreted in one of two ways. An optimistic or positive interpretation would be that increased rooftop solar and storage systems would increase resilience so much so as to render the restoration of the grid to a second order of priority during the recovery period immediately after a natural disaster. That would open up or make funding available to attend to other priorities during the immediate recovery period.
A more pessimistic or negative interpretation would focus on the potential perverse incentives created by additional resilience. Since a large number of people and critical infrastructures would not depend on the grid, government agencies may have less urgency in restoring grid-based service to those who have no choice but to be connected to the grid. Hence, the implicit tradeoff: more resiliency for those with access to DERs may imply longer recovery times for those still connected to the grid because restoring the grid would not be as urgent or important.
In Chapter 12 of the PR100 Final Report, the DOE compared and contrasted different scenarios to better understand the tradeoffs among and between them.
The Impact of Lower Retail Sales
First, the DOE sought to “better understand the impact of differences in demand for electricity.” Combining changes in loads with the impact of DERs on utility costs, allowed the DOE to “better understand the economic implications associated with changes in retail sales.” (PR100 Final Report, p. 435) They did this by comparing the impacts of what they call “the two bookend scenarios”, namely scenario 1MS (Economic Adoption, More Land, Stress Load), which results in the highest level of retail sales by the utility, and scenario 3MM (Maximum Adoption of DERs, More Land, Mid-Case Load), which results in the lowest level of utility retail sales. The results are quite interesting.
First, as shown in the figure below, utility “retail sales [in kWhs] in 2050 drop from 2020 levels by 55% for the lowest forecast (3MM) relative to falling 10% for the highest usage forecast (1MS).” (PR100 Final Report, p. 435) This means that under the Maximum Adoption Scenario, which maximizes rooftop solar systems, electricity sales by PREPA/LUMA/Genera decline significantly, as would be expected. Total system resiliency under this scenario is also expected to be greater.

Source: PR100 Final Report, p. 436
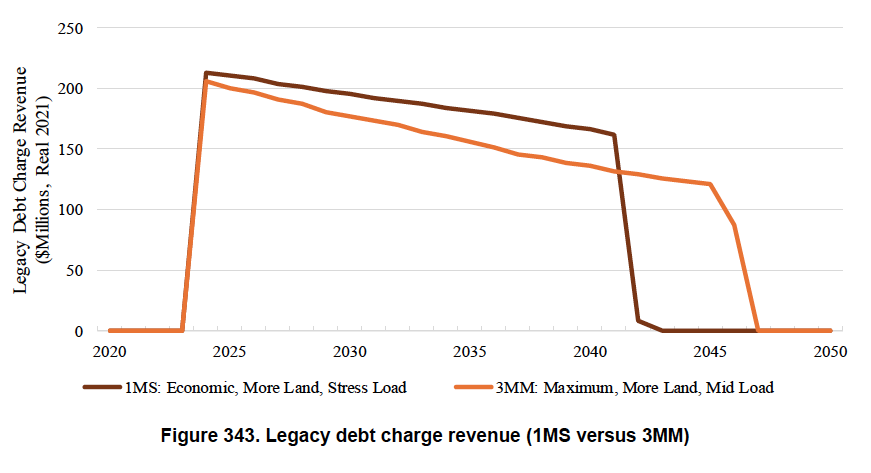
Second, the large reduction in retail sales by the utility between these two scenarios reduces the amount of revenue collected each year by the utility, again as would be expected. However, the sharp decline in retail sales has an adverse impact on the repayment schedule of PREPA’s legacy debt as renegotiated under the POA. According to the DOE analysis, revenues under the 3MM Scenario would decline by so much, that “the repayment date [of the restructured debt] was extended by 4 years for the 3MM scenario.” (PR100 Final report, p. 436) The figure below shows this impact:
 Source: PR100 Final Report, p. 436
So, here is one clear tradeoff: more resiliency under Scenario 3MM results in (1) significantly less revenues for the utility and (2) an extension of the repayment term of the legacy debt.
Third, on the positive side, lower retail sales (in kWhs) also mean lower generation costs for the utility, which should translate into lower rates. However, the reduction in costs modeled by the DOE was not equivalent to the 55% reduction in sales in 2050 between the two scenarios under analysis for two reasons.
- First, “as renewable energy penetration increased, the utility-owned fossil resources produced less energy overall but incurred additional cycling costs to manage the variability of the utility-scale renewable resources and, in conjunction with storage resources, was required to operate in ways that provided grid services that the utility-scale renewable energy resources could not.” (PR100 Final Report, p. 437)
- Second, “the achievement of 100% [renewable portfolio standards] RPS in 2050 forced investment in a portfolio of new resources to provide the comparable grid services required to integrate distributed PV generation.” (PR100 Final Report, p. 437)
Notice another tradeoff here: maximum deployment of DERs significantly reduces the generation costs for the utility but those savings are partially offset by the need to incur additional investments to maintain system stability and reliability over the long term.
The net impact is that while utility electricity sales decline by approximately 55%, the utility revenue requirement (what the utility must charge to cover its costs) decreases by only 24% in the lower retail sales scenario (3MM) relative to the utility revenue requirement under the scenario with the highest sales (1MS). (PR100 Final Report, p. 437) Thus, lower sales under Scenario 3MM do result in an overall reduction in generation production costs but such a reduction is significantly lower than the decrease in total utility retail sales.
Fourth, this is where things get complicated. According to the DOE:
Because utility retail sales in the 3MM scenario declined so much more than utility costs, those costs had to be spread over a much smaller sales base to keep the utility financially healthy. This resulted in an increase in retail rates between 2025, when the electric system achieved a more reliable state of operation, and 2050: moving from 37¢/kWh to 56¢/kWh for the lowest retail sales level…In contrast, the retail rate level modestly drops between 2025 and 2045 for the highest retail sales level (34¢/kWh to 32¢/kWh) and then increases as the utility achieves 100% renewable energy penetration in 2050 (37¢/kWh). (PR100 Final Report, p. 438)
Thus, as shown in the figure below, the all-in average retail is significantly higher under scenario 3MM when compared to Scenario 1MS.

Source: PR100 Final Report, p. 438
As DERs are increasingly deployed under Scenario 3MM, utility costs decrease but, as stated above, by an amount lower than the decrease in total utility sales. As fewer customers remain totally dependent on the grid, total costs have to be apportioned over a smaller customer base, which results in higher rates relative to Scenario 1MS for all those dependent on the grid.
The Impact of Different Levels of Distributed Solar PV
The decision of how many resources should be dedicated to deploying either rooftop solar systems or utility-scale PV generation is one of the most intensely debated issues in Puerto Rico right now. Advocates for rooftop solar rightly emphasize the resiliency advantages of those systems, while advocates of more investment in utility-scale generation, relative to rooftop solar, emphasize the economies of scale and lower costs associated with larger solar generation facilities. To us, it is obvious that Puerto Rico needs both kinds of systems. So, in a certain sense, this is a false choice. But here we are.
Section 12.1.3.7 of the PR100 Final Report details the result of the DOE’s analysis of three scenarios that maintain constant both land use constraints and the load forecast while allowing for different levels of distributed/utility-scale solar PV generation. Those scenarios are 1LS (Economic Adoption, Less Land, Stress Load); 2LS (Equitable Adoption, Less Land, Stress Load); and 3LS (Maximum Adoption, Less Land, Stress Load). This analysis allows the DOE to assess the economic trade-offs associated with each of these scenarios in terms of the deployment of rooftop systems versus utility-scale generation.
The first thing they notice is that “increasing levels of distributed PV adoption under NEM [Net Energy Metering] resulted in increasing distributed PV production (MWh) that could not be integrated on the distribution system without additional infrastructure investments.” (PR100 Final Study, p. 441) As shown in the figure below, this means that as soon as 2037 “distribution system upgrades in the form of storage procured under [power purchase and operating agreements] PPOAs in addition to the requirements [to meet RPS goals] began to be needed to mitigate the integration challenges by the highest distributed PV adoption scenario under NEM.” (PR100 Final Study, p. 442)

Source: PR100 Final Report, p. 442
In terms of the impact on utility-owned generation costs, the DOE found that electricity from rooftop solar systems reduced the amount of utility-scale generation resources required to meet annual energy demand “but the increased level of variability introduced into the net load profile caused offsetting integration costs.” (PR100 Final Report, p. 442)

Source: PR100 Final Report, p. 443
As shown in the figure above, utility-owned generation costs decline modestly in Scenario 3LS relative to Scenario 1LS starting in 2025. However, the decline is “not as large, in percentage terms, as the reduction in retail sales between the two scenarios.” (PR100 Final Report, p. 442) Furthermore, (1) purchased power costs were “nearly identical” across all three scenarios and (2) starting in 2040, “both utility-owned generation and purchased power cost reductions were much smaller, in percentage terms, than the change in retail sales reductions from distributed PV between the highest and lowest level of distributed PV adoption.” (PR100 Final Report, p. 443)

Source: PR100 Final Report, p. 443
Finally, “at the levels of distributed PV penetration seen in the 3LS scenario, the utility incurred substantially more distributed PV integration costs under NEM that offset nearly all the savings from the lower electricity demand.” (PR100 Final Report, p. 443)
Just like in the previous analysis, the lower generation costs were offset by higher distribution system storage/battery costs required for the highest level of distributed PV under NEM. “As a result the total revenue requirement under the highest penetration level of distributed PV was only 1% lower than it is for the lowest penetration of distributed PV in 2050.” This means that the utility revenue requirement is essentially the same under the three scenarios, as shown in the figure below:

Source: PR100 Final Report, p. 444
Finally, “with nearly identical total revenue requirements, the 21% reduction in retail sales (1LS scenario versus 3LS scenario) in 2050 caused rates to be higher by 26” by 2050. See figure below.

Source: PR100 Final Report, p. 444
The tradeoffs, then, are very similar to those in the prior analysis of the “bookend scenarios.” In general, under Scenario 3 relative to Scenario 1 (with both land use constraints and loads held constant): (1) the system is more resilient as there is greater deployment of DERs; (2) retail sales (in kWh) decrease significantly; (3) costs also decrease but by less than the reduction in sales because there is a need to invest more in storage systems; (4) purchased power and operating costs are essentially the same under both scenarios; (5) the total utility revenue requirement remains basically unchanged; (6) lower retail sales under Scenario 3 with essentially the same costs as Scenario 1 translate into higher retail rates for consumers without access to a distributed solar PV system.
To be clear, CNE is not advocating for Scenario 1 over Scenario 3 or any other specific scenario for that matter. Our point is that there are tradeoffs that need to be taken into account by those responsible for managing and planning the electric system. Furthermore, those tradeoffs should be disclosed and clearly explained to the people of Puerto Rico. There are many benefits to having a more resilient system. There are also many costs that need to be incurred to achieve a higher level of resiliency. And those costs would disproportionally fall on those unable (for whatever reason) to install a rooftop solar system. If these facts are disclosed clearly and fairly by decision-makers and the decision is still made to implement Scenario 3, or something close to it, then so be it. But let’s be sure we can pay for it.
Section 3: It’s Expensive
The DOE did not perform an independent analysis of the costs required to bring the electric system “back into a state of good repair, but rather rel[ied] on the FOMB’s 2023 Certified Fiscal Plan for PREPA to identify both the level of investment and the sources of funds to cover that level investment.” (PR100 Final Report, p. 407) According to the DOE analysis, recovery-related investments total $15.441 billion, which includes spending on generation, transmission, and distribution system repairs and replacements, as well as on the Tranche 1 transmission network upgrades.
Notice that the $15.441 billion amount does not include the capital investment necessary to fund new generation as well as the upgrades and extensions of the transmission and distribution (“T&D”) system required to achieve the 100% goal by 2050 (with the exception of the Tranche 1 transmission system upgrade). One independent expert estimated additional T&D capital investments between 2030 and 2035 would add up to an additional $13.6 billion. (London Economics International, Critique of Government Parties’ Assertion that the 9019 Settlement Will Not Affect Non-settling Creditors and Would Avoid a Subsequent Title III Filing by PREPA, October 30, 2019, p. 97, Document #: 1890-1) Keep that in mind as we focus on the resources identified by the DOE to finance the recovery-related investments.
According to the DOE, the following sources of funds are available to cover the $15.441 billion spending on recovery-related investments:
- $13.723 billion from FEMA
- $0.500 billion from HUD
- $0.285 billion dedicated by the Government of Puerto Rico from 2023 to 2025
- $0.193 billion in insurance proceeds
- $0.740 billion collected from ratepayers through 2034, financed via headroom in rates from 2020 to 2028, “at which point PREPA is assumed able to access capital markets after its exit from bankruptcy in 2024.” (PR100 Final report, p. 408)

Source: PR100 Final Report, p. 408
As stated above, there is also a need to make additional investments, beyond the recovery-related capital expenditures set forth above, in order to meet the Act 17 RPS requirements:
- Transmission System Expansion: The interconnection of new renewable resources will require the construction of new tie lines to the bulk power system in Puerto Rico. The DOE assumed different entities would be responsible for covering those costs. First, as stated above, the Tranche 1 transmission network upgrade will be paid for with federal funds. Second, for subsequent tranches “transmission costs were assumed to be financed by third-party renewable development sponsors and thus included in power purchase and operating agreements (PPOAs) until 2028.” Third, commencing in 2028 PREPA “was assumed to be in a position to finance these investments due to its exit from bankruptcy and ability to access capital markets.” (PR100 Final Report, p. 408)
- Distribution System Upgrades: As new DERs and EVs are deployed it will become necessary to upgrade parts of the distribution system. The DOE estimates there will be excess capacity and energy that cannot be integrated into the distribution system starting in 2037. For each scenario, the DOE assumed that these integration challenges would be mitigated by increasing the amount of bulk storage (batteries) on an incremental basis as renewable capacity expanded. This incremental storage was assumed to be procured via PPOAs. (PR100 Final Report, p. 409)
- New Generation: Utility-scale generation as well as bulk storage resources are expected to be procured via PPOAs. (PR100 Final Report, p. 416) With respect to rooftop systems, the DOE, as stated above, “did not assume how those systems would be paid for or whether any public or federal funds would be allocated to pay for them.” (PR100 Final Report, p. 185)
In addition to the costs outlined above, operating the electric system requires paying for other costs such as fuel costs, legacy debt charges, Paygo pension payments, LUMA contract fees and fixed operation and maintenance (“O&M”) costs, Genera contract fees and legacy generation fixed O&M costs, PREPA Holdco fees, CILT and subsidies, and energy efficiency programs, among others.
PREPA, just like most utilities, recovers some costs via basic tariff charges, which are set during general rate cases, and other costs via rate riders that are updated on a more frequent basis. According to the DOE, “basic tariff charges differ by customer class while rate riders can be, and often are, universally applied to all customer classes.” (PR100 Final Report, p. 422)
The DOE assumed the following division between basic tariff charges and rate riders to estimate the utility revenue requirements going forward:

Source: PR100 Final Report, p. 423
We assume that the final allocation will be determined by the PREB but we notice that significant changes to PREPA’s current billing practices may be necessary to reconcile tradeoffs between solvency and equity objectives going forward.
Let’s take one issue that has been in the news recently to analyze some of the equity concerns that may arise going forward. Customers who currently participate in the Net Energy Metering program are compensated for their net energy exports to the grid at the same amount (per kWh) they are charged for their imports from the grid. This may result in an overpayment to those customers because, while it is true that every kWh exported by a NEM customer reduces PREPA’s variable costs (that is, PREPA avoids incurring these costs), there are some fixed costs that the utility has to incur to interconnect NEM customers to the grid. So, while fuel and purchased power costs (from AES and EcoElectrica) may be avoided, other costs such as debt service, pension payments, and the LUMA fees and fixed costs, for example, have to be paid regardless of how much electricity NEM customers export to the grid.
Therefore, net metering customers should be compensated at a rate per kWh equal to (x) the utility’s avoided costs (as defined by the PREB) minus (y) the utility’s fixed costs (as defined by the PREB). Some advocates for rooftop solar systems argue that overpaying net metering customers is justified as a matter of public policy because it helps to speed up the adoption of DERs. We don’t have an issue with that policy as long as it is (1) clearly and transparently stated and (2) customers understand that, everything else being equal, it would result in higher rates (even if only marginally) for those customers who do not participate in the net metering program because fixed costs will have to be recovered from a smaller customer base.
The DOE found that the utility revenue requirement, relative to the $3.2 billion collected in 2020, fluctuates across three time periods. First, there is a “rapid and substantial increase” in utility incurred costs in the first five years of the analysis, “ending at a level between $5.0 billion and $5.3 billion.” Then, between 2025 and 2045 the revenue requirement trends downward to between $3.9 billion and $4.7 billion. Finally, substantial costs have to be incurred to meet the 2050 objective, increasing the revenue requirement to between $4.3 billion and $5.4 billion. (PR100 Final report, p. 425)
The fluctuation in the utility revenue requirement, in turn, results in variations in the estimated all-in average retail rates over the next 25 or so years. According to the DOE:
- Between 2020 and 2025, all-in average retail rates increased between roughly 65% to 80% from their starting level of 19.9 cents per kWh;
- Then, between 2025 and 2045 rates either decreased by up to 0.4% per year or increased by as much as 1.5% per year, depending on the scenario; and
- After 2045, rates increase again rising between 11% and 17% by 2050, again depending on the scenario. (PR100 Final report, p. 429)
The large increase in rates over the first five years of the transition is driven largely by the rapid short-term build-out of utility-scale generation. This build-out is driven, in turn, by two factors: (1) “meeting industry accepted [resource adequacy] performance; and (2) meeting the 40% RPS by 2025.” (PR100 Final report, p. 230) In order to assess the relative contribution of each of these factors to the 2025 build-out, the DOE ran a scenario variation that relaxed the 40% RPS requirement under the 1LS Scenario. They found that “this relaxation significantly changed the technologies and total capacity selected in the build-out relative to the 1LS results; however, the relaxed RPS total capital and operating costs results were within 1% of the 1LS results. This similar cost result suggests that the dramatic build-out of utility-scale generation is driven principally by the requirement to achieve system reliability rather than the requirement to meet the 40% RPS.” (PR100 Final report, p. 230)
In other words, the initial large increase in rates, estimated to be between 65% and 80% relative to 2020 rates, is to a large extent the legacy cost we all have to pay for the decades of corruption, mismanagement, negligent administration, political shenanigans, and postponed maintenance and capital expenditures at the old PREPA. Those who are prone to romanticize the old PREPA are well advised to keep this in mind before they wax poetic about the “good old days”.
Section 4: Is it Good for the Economy?
The DOE estimated the net economic impact of the transition by analyzing two sets of countervailing effects or impact channels on the economy. The first channel considers the stimulative or positive effects associated with higher construction (CapEx) investments and ongoing O&M expenditures for both (1) utility-scale generation, transmission, and distribution and (2) the increased adoption of distributed PV and storage. (PR100 Final Report, p. 486) These investments have positive impacts on employment, earnings, output, and total value added.
According to the DOE, construction and installation activities, which are temporary, create more than six times the number of jobs and earn more than the operation and maintenance efforts, on average. “However, O&M efforts create longer-lasting jobs with higher associated labor hours than temporary construction efforts.” (PR100 Final Report, p. 402) In addition, construction/installation jobs are subject to a “dramatic boom/bust cycle,” increasing rapidly at first to meet the 40% RPS requirement by 2025 and later the 100% RPS requirement by 2050. In contrast, there is more stability in O&M jobs as renewable energy assets are deployed over time. Finally, utility-scale solar supports 44% of all O&M jobs, on average, followed by residential solar with 31% of O&M jobs. (PR100 Final Report, p. 475) Notice the tradeoffs associated with each of the solar PV generation options.
The figure below shows the aggregate amounts of expected CapEx and O&M expenditures, adjusted for inflation, between 2025 and 2050:

Source: PR100 Final Report, p. 493
However, as we stated previously, the transition will be expensive and both households and businesses will face higher electricity prices. The second channel considers the contractionary or negative effects of higher electricity prices. In general, there are two important macroeconomic effects associated with higher electricity prices.
- First, higher prices mean electricity expenditures increase as a share of total spending, reducing the consumption of other goods and services and, thus, overall economic activity decreases.
- Second, as businesses face higher production costs, due to higher electricity prices, they increase the price of their products. Higher inflation leads to lower levels of consumption, production, and employment. Both effects reduce real household income. (PR100 Final Report, p. 486)
The figure below shows the projected average inflation-adjusted electricity rates between 2020 and 2050:

Source: PR100 Final Report, p. 495
Looking at both figures together we discern the following pattern:
- A sharp increase in both capital spending and utility rates during the period between 2020 and 2025.
- During the period between 2025 and 2045, there is less new capital spending relative to period 1, while the adoption of distributed PV increases. Real rates relative to 2025 stay flat or fall for most scenarios during this period, with the notable exception of Scenario 3MM.
- Finally, during the last period between 2045 and 2050, there is another sharp increase in capital expenditures, accompanied by an increase in real rates under all scenarios.
The DOE then proceeded to “disentangle” the simultaneous positive effects due to higher spending from the negative effects of price increases. The figure below shows the dis-aggregated employment effects of the expenditure and price impacts for Scenarios 1LM and 3LS:

Source: PR100 Final Report, p. 497
Under Scenario 1LM in 2025, the investment needed to meet the 40% goal of Act 17 results in more than 16,000 new jobs (blue column). This positive impact, however, is more than offset by the negative effects of higher electricity prices, which induce a loss of 25,000 jobs. The same pattern is observed under Scenario 3LS in 2025.
By 2028, “the expenditure and price impacts are much smaller in magnitude than in Epoch 1. This is because there is relatively little new CapEx in this time frame, and electricity price changes are quite small relative to 2025.” (PR100 Final Report, p. 497)
The story is similar when analyzing the impact on household income. As shown in the figure below, economic activity and employment growth related to new expenditures lead to an increase in household income in 2025 under both Scenarios 1LM and 3LS. However, higher electricity prices over this period lead to a decline in real household income that more than offsets any income gains due to the increase in employment.

Source: PR100 Final Report, p. 498
In sum, according to the DOE model, “for 2025, although some households do benefit from the new jobs created by the CapEx and O&M expenditures, most households in Puerto Rico do not see much benefit; instead, they are adversely affected by the higher electricity prices in the early years.” (PR100 Final Report, p. 498) The DOE notes, though, that “while these adverse effects are substantial, it is important to remember that the 2025 scenario reflects a vastly improved electric system, with more reliability, capacity, and resiliency.” Once again, tradeoffs are unavoidable in this process.
Looking at the whole term of the transition, the economic impact, both on employment and household income, is expected to turn slightly to moderately positive, with some fluctuation depending on the scenario. In terms of the impact on employment, the figure below shows the employment impact for six scenarios out to 2050:

Source: PR100 Final Report, p. 499
- During the first period up to 2025, there is a net decline in employment across all six scenarios, with the largest losses in 3LS (minus 15,894), reflecting the scenarios relatively high price increase and slightly lower CapEx expenditures. The smallest losses are in Scenario 1LM (minus 9,178). (PR100 Final Report, Appendix J, p. 743 and p. 728)
- During the second period (2025-2045) employment “impacts are relatively small relative to 2025, reflecting low levels of new spending and small price changes”. (PR100 Final Report, p. 499) The employment impacts are positive across the entire second period for Scenarios 1LS, 1LM, 1MS, and 2LS. Beginning in 2035, “employment impacts for the scenarios with higher levels of distributed PV adoption (3LS and 3MM) turn slightly negative, reflecting relatively larger electricity price increases.” (PR100 Final Report, p. 500)
- During the final period, between 2045 and 2050, there are significant positive employment impacts. “This reflects higher expenditures as the final investments are made to meet the 100% renewable goals.” In this period, electricity prices also increase, but by a smaller percentage than in Period 1, which means their effects are less detrimental. (PR100 Final Report, p. 500)
The forecast in terms of the impact on household income is fairly similar, as shown in the figure below:

Source: PR100 Final Report, p. 501
- During the first period, all six scenarios reflect losses of real household income. The losses range from $580 million in Scenario 1LM to $864 million in Scenario 3LS. (PR100 Final Report, Appendix J, p. 728 and p. 743) In all six scenarios, the adverse impacts of simultaneous electricity price increases more than offset the gains in employment due to the additional CapEx.
- After 2025 and up to 2045, Scenarios 1LS, 1LM, 1MS, and 2LS show relatively small increases in household income while Scenarios 3LS and 3MM show modest decreases between 2035 and 2045. In general, during this period there are much smaller net effects on real household income, as electricity price changes and CapEx are both much lower than in the first period.
- During the third period, there are positive impacts on real household income across all six scenarios. “Like employment, these increases are largely due to the stimulative impacts of relatively high aggregate expenditures…which are partially, but not fully offset by the real electricity price increases in that time frame…Across the six scenarios, the average increase in real household income is $764 million.” (PR100 Final Report, p. 500.) During this period Scenario 3LS shows the highest increase in household income by 2050, $1.25 billion or 4.74% relative to 2025, while Scenario 3MM shows the lowest increase with $564 million or 2.14% also relative to 2025. (PR100 Final Report, Appendix J, p. 743 and p. 748)
- In general, “increasing levels of distributed PV plus storage adoption were slightly more harmful to the economy relative to a higher reliance on utility-scale renewable energy resources.” (PR100 Final Report, p. 476)
In sum, the economic impact of the transition to 100% renewable generation, as modeled by the DOE, exhibits several tradeoffs that policymakers will need to take into account: (1) between construction and maintenance jobs; (2) among and between the costs and benefits of the different technologies; and (3) between short-term losses and long-term benefits in terms of employment and household income.
Section 5: Risks and Uncertainties
Any process as complicated as the transition to 100% renewable generation will be full of risks and uncertainties. In this section, we highlight some of the most significant in our opinion.
- The Challenge of Stabilizing the System – Puerto Rico’s electric system is functional but fragile. At any given moment more than half of the PREPA’s legacy generation units could be offline either due to unscheduled repairs or because they are subject to time use limitations due to the failure to comply with environmental rules and regulations. On the transmission and distribution side, the PR100 Study has highlighted a significant problem with the lower-voltage (38-kV) transmission network as well as voltage control and backfeeding problems in the distribution system. These issues, by themselves, would present a formidable challenge to any utility to manage. When combined with the transition to full renewable generation the whole system is at risk of becoming unstable. Potentially catastrophic scenarios cannot be fully ruled out if things are not done the right way. Stabilizing the electric system in the short term is of paramount importance and should be the number one priority of policymakers right now.
- Coordination Problems – Coordination among and between (1) federal agencies; (2) federal and Puerto Rico agencies; and (3) Puerto Rico state agencies and municipalities has been problematic ever since the recovery and reconstruction process started. To be fair, some of the initial coordination problems were the product of unreasonable terms and conditions imposed by the Trump administration to intentionally slow down the disbursement of funds to Puerto Rico. And certainly, administrative processes have improved over the last six or so years. Yet coordination problems still remain and have plagued policymaking regarding the reconstruction of the system, the procurement of utility-scale renewable generation, and the timeline for decommissioning fossil fuel legacy assets. In our view, the PREB should be the agency taking the lead in coordinating the actions of the multiple stakeholders in this process as well as the forum for resolving knotty policy and technical issues.
- Cost/Resiliency/Reliability Tradeoffs – It is clear from the PR100 Final Report that there is a tradeoff between systemic resiliency and costs, both in terms of the rates paid by customers that remain dependent on the grid and in macroeconomic terms. Customer rates and negative short-term macroeconomic effects (in terms of lower employment and household income) tend to be higher under all variations of Scenario 3. In addition, system reliability could be compromised to the extent that excess PV capacity and energy cannot be integrated into the distribution system starting as soon as 2037. If the decision is made to prioritize and put a premium on resiliency rather than on lower costs, then that decision should be made and explained to customers as transparently and clearly as possible so they can plan accordingly.
- Compensation for Net Energy Metering – Participants in the net metering program currently receive a full kilowatt-hour credit on their energy bills for every kilowatt hour they export to PREPA. This means that those customers do not pay the fixed costs of maintaining the electric grid. Therefore, PREPA’s operational and maintenance costs are disproportionately borne by customers unwilling or unable to participate in the net metering program. Act 17 required the PREB to undertake a study of the net metering program by April 2024 to determine whether the current system is adequately structured. However, that study has not been done. Unfortunately, this has become a political issue as the Puerto Rico legislative assembly has enacted another law that orders the PREB to postpone any such study until 2030 and the FOMB has taken the position that this constitutes an undue interference with the work of the PREB. Leaving political turf battles aside, we believe the NEM study should be executed as soon as possible and its findings should be made public and widely divulged. Again, if the policy decision is made to overcompensate participants in the net metering program to incentivize the installation of rooftop solar systems, then that decision should be explained clearly to all electric customers, including the disclosure that, everything else being equal, it would result in higher bills (even if only marginally) for customers that do not participate in the program.
- Policy and Regulatory Constraints Regarding the Contribution of Distributed PV to Achieve the RPS Goals – The DOE configured its model to count generation from distributed PV toward the achievement of renewable generation goals. However, “the utility and operator do not yet have policies, metering, or an accounting method in place to do so. Further guidance and regulations on renewable energy certificates will clarify the contribution of distributed renewable generation toward the RPS.” (PR100 Final Report, p. 214) Additional policy guidance is also required to determine the amount of rooftop solar capacity and utility-scale PV generation that will be deployed to meet the statutory RPS requirements. The disagreement between the proponents of each option has caused undue delays in the deployment of renewable generation and only benefitted fossil fuel suppliers.
- Reaching 40% RPS by 2025 Appears Unfeasible – According to the DOE analysis, “deployment of renewables at a rate to achieve the 40% RPS goal would require a rapid rate of procurement of over 100 MW per month through 2025 from a level of minimal utility-scale build-out in recent years. This rate of deployment would be challenging to achieve.” (PR100 Final Report, p. 229) While we appreciate the gracious and diplomatic drafting of the authors of the PR100 Final Report, the reality is that PREPA, LUMA, and Genera don’t have in place the operating framework to support this rapid build-out; the T&D system needs to be upgraded before this amount of capacity and energy can be integrated into the grid; and procurement has been slow due to policy disagreements and coordination problems. Therefore, the most likely scenario is that Puerto Rico will miss the 40% goal by 2025. Given that scenario, Puerto Rico will be better off extending the intermediate goals to reach 100% renewable generation by 2050 and doing things right rather than carelessly and unthinkingly rushing to meet the 40% goal.
- Obtaining Funding for the Grid Upgrade Remains Challenging – The DOE estimates that recovery-related investments total $15.441 billion, including generation, transmission and distribution system repairs and replacements, as well as Tranche 1 transmission network upgrades. As we stated above, at least one independent expert estimated additional T&D capital investments between 2030 and 2035 would add up to an additional $13.6 billion. Even if we cut that estimate by half, given that it was made by a consultant hired for litigation purposes, obtaining $6.8 billion in additional financing will not be an easy task. According to the DOE, “capital costs for energy projects in Puerto Rico were significantly higher than they were in the 50 U.S. states. Local factors that lead to elevated costs include transportation of component parts and materials, persistent industry-wide supply chain issues from the COVID-19 pandemic, inflation, and international conflict.” (PR100 Final Report, p. 72) Furthermore, Puerto Rico regulatory requirements may affect the final cost of any given project. While some of these issues may eventually resolve themselves, currently a high level of uncertainty regarding the financing of capital expenditures remains.
- PREPA’s Access to Capital Markets – Right now PREPA does not have access to the capital markets as it is still undergoing a bankruptcy process. Given that situation, the DOE assumes PREPA will exit bankruptcy in 2024 and will have access to the capital markets by 2028 and, thus, the ability to finance upgrades to the transmission and distribution system going forward from 2028. In our view, this assumption could be overly optimistic for several reasons. First, it is by no means clear that PREPA will exit bankruptcy in 2024. Even if a POA is certified by the Federal Court this year, several creditors have already indicated they will appeal such certification, potentially adding several years of litigation to this process. Second, a restructured PREPA will be limited in its ability to issue new debt until the bonds issued as part of the current restructuring are paid in full. We don’t know yet what legal and financial conditions PREPA will have to satisfy (in the form of financial covenants limiting new debt issuance and legal subordination requirements) in order to issue new debt after 2028. Finally, any announcement regarding the issuance of new debt by PREPA will probably face significant backlash from customers and other stakeholders who remember waste and mismanagement at the old PREPA.
- Uncertainty Regarding Energy Efficiency Measures and EVs – There is significant uncertainty regarding the implementation of energy efficiency measures and the adoption of electric vehicles in Puerto Rico. These two factors impact load forecasts in opposite directions: increased energy efficiency reduces demand for electricity while relatively high adoption of EVs increases demand for electricity. In our view, the most likely scenario right now is that Puerto Rico will not meet its energy efficiency objective because it is not making the necessary investments to achieve it, while the adoption of EVs is likely to be at a lower rate than in the U.S. due to Puerto Rico’s lower wages and income.
- Risk of Grid Defection/Death Spiral – Under several of the scenarios modeled by the DOE, the volume of electricity sales declines faster than the total cost required to serve customers. This means that the rate per kWh increases and adds to the financial burden of existing customers, leading to even more “grid defection” (mostly higher income individuals and industrial/commercial clients), which means the remaining costs of service are spread over an even smaller customer base, leading to even higher electricity rates, and so on. This cycle is called a “utility death spiral” and while a complete utility death spiral has yet to be experienced in the U.S. electricity sector, in the case of Puerto Rico this risk cannot be ruled out. The DOE vaguely hinted as much when it stated that “PR100 analyzed a highly centralized utility in a future that was increasingly comprised of distributed and decentralized electricity resources which were neither owned nor controlled by the utility. Our analysis illustrates the implications of this seemingly dichotomous future: utility costs could not be reduced as quickly as retail sales resulting in higher retail rates.” (PR100 Final Report, p. 446)
Conclusion
Five years ago, Puerto Rico enacted legislation setting the ambitious goal of generating 100% of its electricity from renewable sources by 2050 even as it rebuilt its electric grid, which was devastated by Hurricane María in 2017. This is a clear and compelling objective that is worth pursuing. Yet success is not guaranteed because it is also incredibly complicated. The policy questions require analyzing theoretical, technical, and economic constraints as well as making difficult tradeoffs among and between complex economic, technical, and social objectives. In addition, the technology is still evolving. In that sense, there is a tension between the technology that is already available now and the technology that is not yet viable or commercially available.
We also need to note that the transition to 100% renewable generation has a political economy dimension, as the old technology (and those who benefitted from it) is replaced by a still evolving new one (and those who stand to gain from it). Humanity’s natural resistance to change is thus reinforced by powerful economic and financial incentives.
Furthermore, during the last five years, Puerto Rico has fallen behind schedule to meet the interim objective of 40% renewable generation by 2025 due to bureaucratic and coordination failures. We are, therefore, at a critical juncture. We still have time to rebuild our electric grid and to completely switch away from fossil fuel generation by 2050. But achieving those objectives will require strategic thinking, skilled policymaking, competent execution, tactical dexterity, the ability to act collectively over the long term, and inspired leadership—resources that have been in short supply in Puerto Rico for at least a generation. Make no mistake, this endeavor will be challenging, hard, and expensive. There will be setbacks along the way. But it is the right thing for Puerto Rico to do for the generations yet to be born. So, we better get working if we are going to make it.
Let’s get going.