Who's at Risk From COVID-19? A Closer Look at Occupations in Puerto Rico
Published on April 30, 2020 / Leer en español
Updated on May 19, 2020
AUTHORS
Research Director
Research Associate
DOWNLOAD
RELATED CONTENT
SHARE
As discussions of “reopening” the Puerto Rican economy advance, we feel it’s important to consider which workers face greater risks of becoming infected with the coronavirus, given some particular attributes of their occupations. For example, because some occupations require constant person-to-person interactions, like dentists and flight attendants, and others only on occasion—think of sculptors and archivists—the risk of infection varies significantly depending on the kind of job you have and how you work.
To identify the risk profile of occupations in Puerto Rico, we combined data from the Bureau of Labor Statistics (BLS) and the O*Net Program, which publishes detailed databases that include a series of occupation-specific descriptors. Our methodology is similar to the one employed by Marcus Lu from Visual Capitalist, save for some key adjustments. From the BLS databases, we include the annual median wages and the total number of people employed as of May of 2019 (the latest data available). From the O*Net data (published in August of 2019), we incorporated three job attributes, each ranked from low (1) to high (5):
- Whether a job requires a high or low degree of contact with others;
- Physical proximity to others; and
- Exposure to diseases or infections
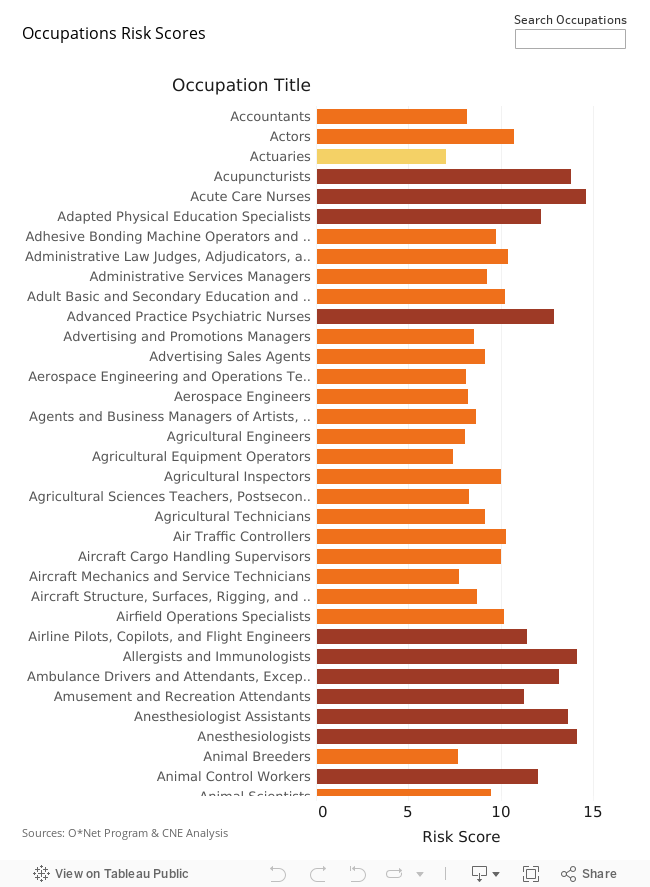
The sum of the three job attributes scores yields the “Risk Score”, which ranges from 5.41 (relatively low risk) to 14.67 (high risk). A PDF file with the full table of occupations can be found in the downloads section of this page.
In conducting this analysis, our goal is not to determine which firms or businesses should open first as shelter in place measures are relaxed. However, we hope that these results can inform analyses being conducted by medical and public health experts. More importantly, risk scores can move upwards or downwards depending on the safety measures taken by business owners, managers, and workers. Thus, these figures should be taken as benchmarks for planning and preparation purposes.
Puerto Rico Occupations Risk (PROR) Dashboard
We developed a Puerto Rico Occupations Risk (PROR) dashboard, for users interested in gathering further insights on occupations, their risk indicators, and job attributes. It provides key details for specific occupations.
The data for the tables and graphs in the dashboard can be filtered interactively and downloaded so that users can perform other analyses. Through the “Search occupations” search bar, users can filter by job attributes and risk scores for each occupation. Clicking on any of the items in the tables and graphs allows users to filter and analyze data on the selected attributes. Keep in mind that selecting the “keep only” option, when clicking on a specific attribute, will eliminate all other data from your selection. Selecting the “exclude” option, when filtering, will eliminate all data related to your selected attribute.
The dashboard is optimized for desktop use. To view the dashboard in full-screen mode, press the icon ![]() in the lower right corner.
in the lower right corner.
The dataset can be downloaded by clicking on the icon ![]() in the lower right corner.
in the lower right corner.
If any problems arise, we recommend starting over by refreshing the page. Any specific questions on how to use the dashboard can be sent to: info@grupocne.org.
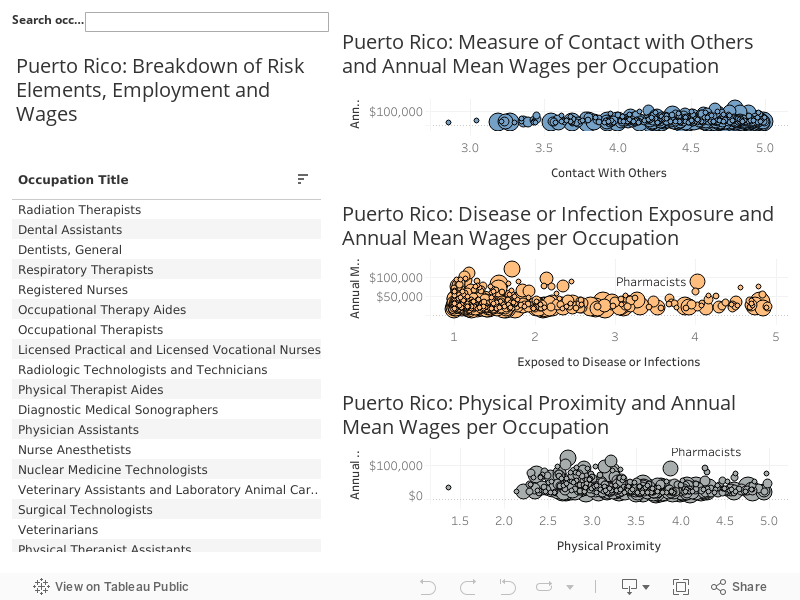
Visuals in the PROR Dashboard include:
- Top left corner: A search bar to filter visualizations by occupation.
- Bottom left corner: A table listing job occupations in Puerto Rico, their total employment in the island, mean annual wages, and corresponding risk score. The occupations in the table are sorted by risk score, from higher to lower values.
- Top right graph: A scatterplot showing measures of the “contact with others” job attribute and annual wages per occupation. The data points (circles) are sized according to total employment for that occupation.
- Middle right graph: A scatterplot showing measures of the “exposure to disease and infections” job attribute and annual wages per occupation. The data points (circles) are sized according to total employment for that occupation.
- Bottom right graph: A scatterplot showing measures of the “physical proximity” job attribute and annual wages per occupation. The data points (circles) are sized according to total employment for that occupation.
Because the PROR Dashboard does not include all occupations in Puerto Rico, given certain data constraints, we also included a table below with the risk profiles for the full list of the occupations included in the O*Net Database. Occupations can be filtered using the search bar at the top right corner of the table.