Industrial Sectors and Risk From COVID-19 in Puerto Rico
Published on May 27, 2020 / Leer en español
AUTHORS
Research Director
Research Associate
RELATED CONTENT
SHARE
The new executive orders enacted by the Government of Puerto Rico, which have allowed more businesses to begin operating after a long lockdown period, have once again raised concerns about the risks of exposure to the coronavirus. As a follow up to previous analyses we conducted on risk by occupations, we produced a new dashboard focused on Puerto Rico’s industrial sectors.
Using the data on risk by occupations, we estimated risk scores for each industry by taking into account the kinds of workers employed and how they do their jobs. In order to incorporate both health and economic factors into our analyses, we also examined the total number of persons employed in each industry segment, and how much each sector contributes to our local economy, as a percent of Gross Domestic Product (GDP).
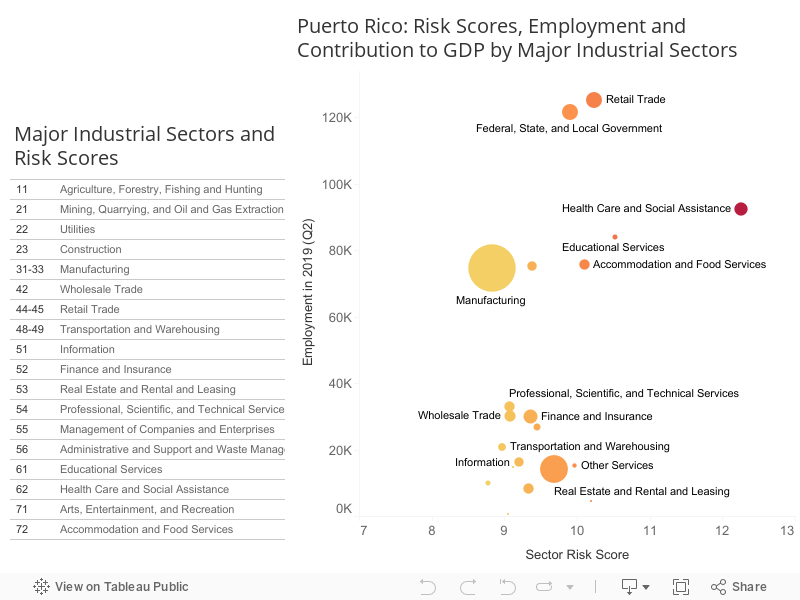
The scatterplot below, shows each sector’s risk score, employment, and contribution to GDP (measured by the size of the bubble). The accompanying table provides a list of all major sectors and their risk scores.
Our results show that the healthcare, education, and retail sectors have the highest risk scores, while agriculture, manufacturing, and transportation and warehousing have the lowest ones. In terms of economic importance, the manufacturing sector stands out over all others since it employs over 70,000 persons and is the main contributor to our GDP. Despite their relatively low contributions to GDP, the retail trade government sectors each employ over 120,000 persons locally, and fall somewhere in the middle of the range of risk scores.
As the local government continues to make decisions regarding which economic sectors can be fully reactivated, they must perform a careful analysis that considers, amongst other things, exposure to health risks, mitigation opportunities, and economic impacts. We hope that this tool provides key pieces of information for health experts and government advisors as they continue to make decisions regarding our pandemic futures.
Industrial Sectors and Risk From COVID-19 Dashboard
The following graphs provide measures of Covid-19 infection risk, and other economic variables, for major industrial sectors in Puerto Rico.
The dashboard is optimized for desktop use. To view the dashboard in full-screen mode, press the icon ![]() in the lower right corner.
in the lower right corner.
We used the data on risk by occupations to calculate a score for each major sector. The table below provides the color-coded risk scores, on a gold-red spectrum, for each sector, which range from 8.78 (lesser risk) to 12.26 (higher risk). The graph to the right is a scatterplot showing measures of the risk scores and total employment by sector. The data points (circles) are sized according to each sector’s contribution to Puerto Rico’s economy, as a percent of GDP.
Clicking on any of the items in the tables and graphs allows users to filter and analyze data on the selected attributes. Keep in mind that selecting the “keep only” option, when clicking on a specific attribute, will eliminate all other data from your selection. Selecting the “exclude” option, when filtering, will eliminate all data related to your selected attribute.
A detailed explanation on data sources, and how the sector score was constructed, is provided in the methodology section below the dashboard. The dataset can be downloaded by clicking on the icon ![]() in the lower right corner.
in the lower right corner.
If any problems arise, we recommend starting over by refreshing the page. Any specific questions on how to use the dashboard can be sent to: info@grupocne.org.
Methodology for calculating risk scores for each major industrial sector
1- To identify the occupational structure of major industrial sectors (2-digit NAICS), we downloaded the May 2019 National Industry-Specific Occupational Employment and Wage Estimates table for the United States from the Bureau of Labor Statistics. Because we could not find a Puerto Rico-specific table, we assumed that the occupational structure for major industrial sectors in the United States applies to Puerto Rico.
2- We merged this table with the occupation and “risk scores” tables previously prepared that incorporate O*Net program and BLS data.
3- We created a new table that includes data on risk by occupation, and employment by sector and occupations, for the United States.
4- We calculated the proportion of persons employed by occupation, for each industrial sector.
5- We calculated a relative risk score: multiplying the risk scores from the O*Net program data by the proportion of persons employed by occupation calculated in Step 4. This provided a relative risk score for each occupation in a given sector.
6- We added all the relative risk score values. The total figure provides a weighted risk estimate for each major sector.
Data Sources: O*Net Database, Bureau of Labor Statistics, Puerto Rico Department of Labor, Puerto Rico Planning Board, and CNE